The US Presidential election system is not the most straightforward thing in the world. The President is not directly elected by popular vote, but is instead elected by the members of the Electoral College. These members are chosen by the individual states, with each state receiving as many electors as it has members of Congress. Most states select their electors on a winner-takes-all basis. Maine and Nebraska use a split system whereby some electors are determined by popular vote and others are determined by the popular vote winner in specific electoral districts.
Since there are five hundred thirty eight members in the Electoral College and a clear majority is needed, two hundred seventy electoral votes are needed for a victory. This has various effects on the Presidential campaigns — mostly involving candidates spending a lot of time and money courting votes in large “swing states” (states with a large number of electors where the outcome is uncertain.)
Various pollsters and pundits have tried to predict the outcome of the election. Nate Silver’s “Five thirty eight” blog has come up with an estimate of the odds of each candidate winning each state’s electoral votes (including Congressional districts in Maine and Nebraska.) From this, it’s possible to predict the outcome of the election, using Monte Carlo analysis.
Using Five Thirty Eight’s data (text file contains district abbreviation, odds of a Democratic victory in that district, and its number of electors for this year), I ran the simulated 2012 Presidential election (FreeBASIC code) one billion times. (Hey, if it’s worth doing, it’s worth overdoing!)
The results are encouraging for a secular, liberal/libertarian geek like me:
| Runs: | 1,000,000,000 |
| Democratic victories: | 960,093,075 |
| Electoral College ties: | 2,608,646 |
| Republican victories: | 37,298,279 |
|
|
|
| Democratic victory %: | 96.01% |
| Electoral College tie %: | 0.26% |
| Republican victory %: | 3.73% |
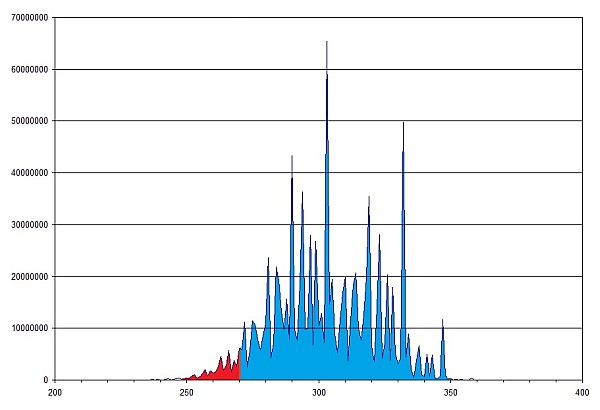
Here’s a histogram of the relative probability of each number of electoral college votes for President Obama. (Anything 270 or greater is a Democratic victory.)

A histogram of the projected probabilities of the Electoral College outcomes, according to the simulation. (Click for larger.)
I hope Mr. Silver’s analysis is correct. We really don’t need another four years of corporate cronyism and Bible-thumping anti-intellectualism.

